Closing deals in the competitive SaaS industry is challenging. A non-linear sales cycle will have leads navigating different touchpoints before converting. Strategically tracking the right pipeline metrics provides transparency, helping you gauge the health of your sales process.
Optimizing the sales pipeline can ensure faster conversions – the first step to unlocking revenue growth.
Why is it important to track metrics?
A lead in a typical sales cycle (from lead acquisition to conversion) interacts with sales personnel, downloads resources to learn more about the product, attends a webinar to have hands-on experience during the trial period, and does much more. When a lead is in the conversion process, it is often dubbed to be in a sales pipeline wherein it moves from one point to another.
Slow-moving leads indicate conversion bottlenecks, especially in the B2B SaaS industry, where conversions range from 1% to 5%.
This article highlights five critical pipeline metrics for boosting conversions. Consider pivoting your resources to these metrics to move targets and strategically move toward higher efficiency, effectiveness, and growth.
Metric #1: Sales Pipeline Velocity
This is a dynamic metric that measures the speed at which leads move through your sales pipeline to become customers. It tracks the average time (duration) it takes for deals to move from one stage of the sales cycle to the next.
Here’s how to calculate sales pipeline velocity:
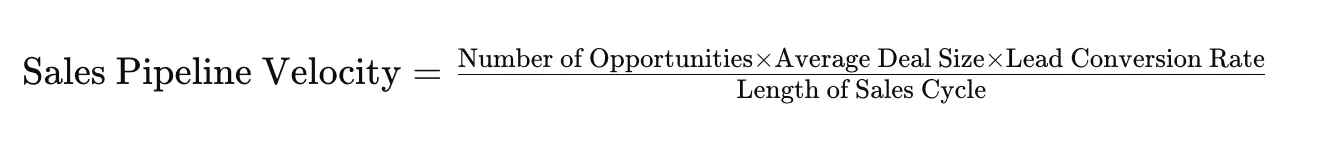
Tracking this metric helps you assess the overall efficiency of your sales process. It allows you to identify bottlenecks and paves the way for effective pipeline forecasting of how quickly you can generate future sales.
Here are a few more reasons to consider tracking sales pipeline velocity:
- You can identify bottlenecks in the sales pipeline and pinpoint areas where deals are getting stuck. For example, you can determine whether leads are moving slowly through the pipeline due to internal factors such as slow approvals or buyer behavior such as lengthy decision-making processes.
- By understanding the areas that slow velocity, you can optimize processes and remove barriers to efficiency. For example, if you sell billing and invoicing software, the sales cycle is too long to close leads. Here, insights from velocity tracking can help you make informed decisions about updating your product by streamlining billing and invoicing software, offering more invoicing integrations with other tools, or focusing on sales and marketing strategies. For the latter, you’d revise proposals or change the marketing message.
- Get accurate pipeline forecasts with identified velocity to predict the revenue you’re likely to generate in a given timeframe.
Metric #2: Lead-to-Sales Conversion Rate
This metric measures the percentage of leads that convert into qualified sales opportunities, turning them into paying customers (actual sales).
Here’s the formula:
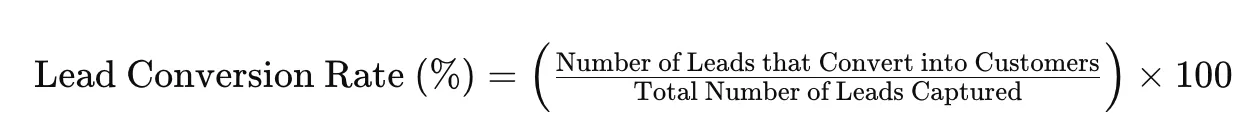
A low conversion rate indicates problems in your lead qualification process. It also means there is a scope to attract leads that could be better fitted for your product, or your sales team needs to nurture those. Conversely, a strong conversion rate indicates a well-aligned marketing and sales effort.
Here’s why you should be tracking this pipeline metric:
- It directly impacts revenue and profitability, making it a key metric for financial planning and forecasting.
- Help understand the segments of your market that are highly profitable or present more significant growth opportunities.
- Empower making strategic decisions regarding product pricing, bundling, and market positioning.
Using the lead-to-sales conversion metric, you can unlock the following:
- Optimize lead nurturing: Create and run targeted ads as part of engagement strategies for different buyer journey stages. Use them to address relevant pain points so buyers see value in your solution.
- Improve lead qualification: Implement or enhance lead scoring models to prioritize high-potential leads. This will have teams focusing on leads with higher chances of conversion.
- Align sales and marketing: Establish clear handoff procedures for leads. Both teams should know how marketing-qualified leads (MQLs) can transition to sales-qualified leads (SQLs). It helps prevent positive prospects from slipping through the cracks.
Metric #3: Average Deal Size (ADS)
The average deal size metric measures how much average revenue you could generate from each sale or closed deal.
Here’s how you measure it:
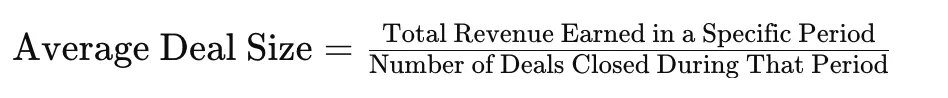
This impact metric measures how much your customers value your product or service. It has significant implications for your growth strategy and revenue forecasting.
Here are some key reasons why this is an effective pipeline metric to track:
- A higher ADS means that you are attracting larger, higher-value clients. Conversely, a low ADS suggests the need to make your product a target market fit, which means that a larger chunk of users cannot fully maximize the value of your solution.
- Use this metric to leverage upselling and expansion opportunities. Identify potential clients who are most likely to purchase additional features or upgrades.
- Feed your product management team to make strategic pricing, bundling, and market positioning decisions.
Below are some of the major ways to use average deal size as a key metric to track and boost conversions:
- Target high-value segments: Market research and customer data can help identify and target customer segments that have a high potential to close larger-size deals. Hence, let your sales and marketing team work towards attracting more quality prospects who can turn into high-paying clients.
- Segment by customer profile: Break down your ADS by factors like company size, industry, or buyer persona. This will show you the segments that offer the best return.
- Refine your value proposition: Your communications should highlight the ROI your solution provides for larger accounts. For this, train your sales team to focus on your product’s value to customers. This approach encourages upsells and cross-sells to increase the deal size.
Metric #4: Customer Acquisition Cost (CAC)
CAC measures the average cost of acquiring a new paying customer. It considers all sales and marketing expenses associated with the customer acquisition process.
Here’s the formula:
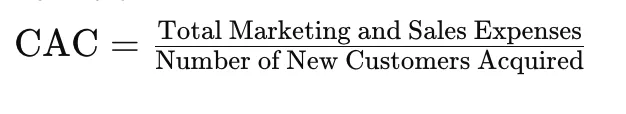
This is a key metric that helps assess how effective your sales and marketing strategies are for sustainable growth.
Here are some key reasons for tracking this metric to boost conversions.
- CAC fuels your pricing decisions so that the price point covers the acquisition cost and delivers a healthy profit margin.
- Gain insight into the efficiency of your marketing and sales efforts regarding how resources are utilized.
- Make data-backed decisions for marketing and sales to ensure cost-effective customer acquisition.
When you have CAC, use it in the following way to boost conversions:
- Benchmark CAC across channels: Calculate CAC for each marketing and sales channel to compare and identify channels that deliver high returns. Use it to focus resources on high-performing channels that reduce overall CAC and boost conversions by optimizing customer acquisition efforts.
- Test and iterate: Optimizing CAC requires continuous testing and iteration. Evaluate and refine marketing and sales strategies based on A/B testing data and other experiments. This helps identify the most effective methods for reducing CAC and improving customer engagement, thus boosting conversion rates.
- Focus on customer retention: CAC is only one part of the picture. You also need to consider the customer lifetime value (CLV), which helps justify a greater investment in acquisition if retention is strong.
Metric #5: Customer Lifetime Value:Customer Acquisition Cost (CLV: CAC) Ratio
This metric compares and measures the relationship between the Customer Lifetime Value (CLV) and your Customer Acquisition Cost (CAC). Leverage it to assess the long-term financial sustainability and profitability of a business’s customer acquisition and retention strategies.
A common benchmark for a healthy SaaS company is a CLV:CAC ratio of at least 3:1, meaning customers spend 3X more than the cost you incur in acquiring them.
Here’s how you can calculate this:
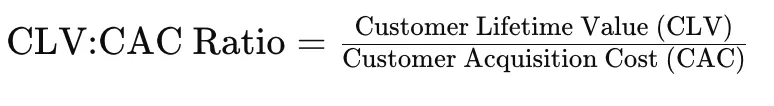
CLV: The CAC ratio metric shows how much revenue each acquired customer generates throughout the business in relation to the cost of acquiring them.
Why should you track this metric?
- A ratio significantly greater than one indicates healthy profitability. Your customers are generating much more revenue than they cost to acquire.
- It helps determine how much you should invest in acquiring and retaining new customers.
- Tracking CLV:CAC per customer segment helps identify types of customers that provide the best returns and target them for acquisition.
Below are some major ways to use the CLV:CAC ratio for effective conversions.
- Adjust pricing strategies: Reevaluate pricing to reflect the value your product provides. It can potentially increase CLV without significantly impacting CAC.
- Optimize acquisition strategies: A low ratio requires reworking strategies to reduce CAC or increase CLV. Consider improved targeting, putting in retention efforts, or value optimization throughout the sales and marketing communication.
- Improve both metrics: You don’t need to focus solely on lowering CAC to increase conversions. Consider pivoting to retention and upselling strategies that increase CLV.
Wrapping Up
- All the aforementioned metrics offer a roadmap for SaaS businesses to navigate the complexities of customer acquisition and retention. The takeaway is clear: these metrics can act as a compass.
- To empower your sales team, you must continuously monitor, analyze, and optimize these key data points. By monitoring these metrics, your sales team can better target customers, close faster, and drive revenue growth.
- Emphasize continuous testing, refinement, and adaptation throughout the pipeline. When done correctly, this will help adopt a proactive growth approach that prioritizes efficiency, profitability, and customer value.
The opinion of the author of the guest post may not reflect the position of the editorial board and specialists of Netpeak Agencies Group.

 2
2
 2
2
 0
0
Related Articles
Agency vs. In-House vs. Freelance: What to Choose for Website Maintenance
I'll break down the pros and cons of each model according to your tasks, goals, and current stage of business development
Email Newsletters for Online Stores, From Idea to Launch
Email newsletters are one of the most useful tools on the way to sales success and recognition. Let's take a look at how they can generate revenue
GA4 Attribution Model Comparison Report: A Complete Guide
The report shows the performance of campaigns and channels for a given time period, comparing only attribution models.